RetrogeneDB ID: | retro_hsap_2030 | ||
Retrocopylocation | Organism: | Human (Homo sapiens) | |
| Coordinates: | 19:12754091..12754733(-) | ||
| Located in intron of: | None | ||
Retrocopyinformation | Ensembl ID: | ENSG00000178464 | |
| Aliases: | None | ||
| Status: | KNOWN_PSEUDOGENE | ||
Parental geneinformation | Parental gene summary: | ||
| Parental gene symbol: | RPL10 | ||
| Ensembl ID: | ENSG00000147403 | ||
| Aliases: | RPL10, AUTSX5, DXS648, DXS648E, L10, NOV, QM | ||
| Description: | ribosomal protein L10 [Source:HGNC Symbol;Acc:10298] |

Retrocopy-Parental alignment summary:
>retro_hsap_2030
ATGGGCCGCCGCCCCGCCCGTTGTTACCGGTATTGTAAGAACAAGCCGTACCCAAAGTCTCGCTTCTGCCGAGGTGTCCC
TGATGCCAAGATTCGCATTTTTGACCTGGGGCGGAAAAAGGCAAAAGTGGATGAGTTTCCGCTCTGTGGCCACATGGTGT
CAGATGAATATGAGCAGCTGTCCTCTGAAGCCCTGGAGGCTGCCCGAATTTGTGCCAATAAGTACATGGTAAAAAGTTGT
GGCAAAGATGGCTTCCATATCCGGGTGCGGCTCCACCCCTTCCACGTCATCCGCATCAACAAGATGTCGTCCTGTGCTGG
GGCTGACAGGCTCCAAACAGGAATGCGAGGTGCCTTTGGAAAGCCCCAGGGCACTGTGGCCAGGGTTCACATTGGCCAAG
TTATCATGTCCATCCGCACCAAGCTGCAGAACAAGGAGCGTGTGATTGAGGCCCTGCGCAGGGCCAAGTTCAAGTTTCCT
GGCCGCCAGAAGATCCACATCTCAAAGAAGTGGGGCTTCACCAAGTTCAATGCTGATGAATTTGAAGACATGGTGGCTGA
AAAGCGGCTCATCCCAGATGGCTGTGGGGTCAAGTATATCCCCAATCGTGGCCCTCTGGACAAGTGGTGGGCCCTGCACT
CA
ORF - retro_hsap_2030 Open Reading Frame is conserved.
Retrocopy - Parental Gene Alignment summary:
| Percent Identity: | 98.6 % |
| Parental protein coverage: | 100. % |
| Number of stop codons detected: | 0 |
| Number of frameshifts detected | 0 |
Retrocopy - Parental Gene Alignment:
| Parental | MGRRPARCYRYCKNKPYPKSRFCRGVPDAKIRIFDLGRKKAKVDEFPLCGHMVSDEYEQLSSEALEAARI |
| MGRRPARCYRYCKNKPYPKSRFCRGVPDAKIRIFDLGRKKAKVDEFPLCGHMVSDEYEQLSSEALEAARI | |
| Retrocopy | MGRRPARCYRYCKNKPYPKSRFCRGVPDAKIRIFDLGRKKAKVDEFPLCGHMVSDEYEQLSSEALEAARI |
| Parental | CANKYMVKSCGKDGFHIRVRLHPFHVIRINKMLSCAGADRLQTGMRGAFGKPQGTVARVHIGQVIMSIRT |
| CANKYMVKSCGKDGFHIRVRLHPFHVIRINKM.SCAGADRLQTGMRGAFGKPQGTVARVHIGQVIMSIRT | |
| Retrocopy | CANKYMVKSCGKDGFHIRVRLHPFHVIRINKMSSCAGADRLQTGMRGAFGKPQGTVARVHIGQVIMSIRT |
| Parental | KLQNKEHVIEALRRAKFKFPGRQKIHISKKWGFTKFNADEFEDMVAEKRLIPDGCGVKYIPNRGPLDKWR |
| KLQNKE.VIEALRRAKFKFPGRQKIHISKKWGFTKFNADEFEDMVAEKRLIPDGCGVKYIPNRGPLDKW. | |
| Retrocopy | KLQNKERVIEALRRAKFKFPGRQKIHISKKWGFTKFNADEFEDMVAEKRLIPDGCGVKYIPNRGPLDKWW |
| Parental | ALHS |
| ALHS | |
| Retrocopy | ALHS |
Legend:
| * | Stop codon |
| > | Forward frameshift by one nucleotide |
| < | Reverse frameshift by one nucleotide |
(Hint: click retrocopy or parental gene accession number on the plot's legend, to show / hide expression level values)
Expression validation based on RNA-Seq data:
| Library | Retrocopy expression | Parental gene expression |
|---|---|---|
| bodymap2_adipose | 3 .98 RPM | 465 .66 RPM |
| bodymap2_adrenal | 5 .81 RPM | 522 .26 RPM |
| bodymap2_brain | 0 .68 RPM | 102 .06 RPM |
| bodymap2_breast | 2 .45 RPM | 310 .82 RPM |
| bodymap2_colon | 6 .86 RPM | 703 .36 RPM |
| bodymap2_heart | 0 .52 RPM | 249 .13 RPM |
| bodymap2_kidney | 1 .80 RPM | 366 .37 RPM |
| bodymap2_liver | 0 .46 RPM | 302 .00 RPM |
| bodymap2_lung | 1 .83 RPM | 1014 .17 RPM |
| bodymap2_lymph_node | 2 .50 RPM | 1033 .94 RPM |
| bodymap2_ovary | 7 .48 RPM | 739 .54 RPM |
| bodymap2_prostate | 4 .23 RPM | 1347 .95 RPM |
| bodymap2_skeletal_muscle | 2 .29 RPM | 691 .03 RPM |
| bodymap2_testis | 2 .49 RPM | 282 .25 RPM |
| bodymap2_thyroid | 2 .35 RPM | 300 .94 RPM |
| bodymap2_white_blood_cells | 2 .40 RPM | 1398 .58 RPM |
RNA Polymerase II actvity near the 5' end of retro_hsap_2030 was not detected
No EST(s) were mapped for retro_hsap_2030 retrocopy.
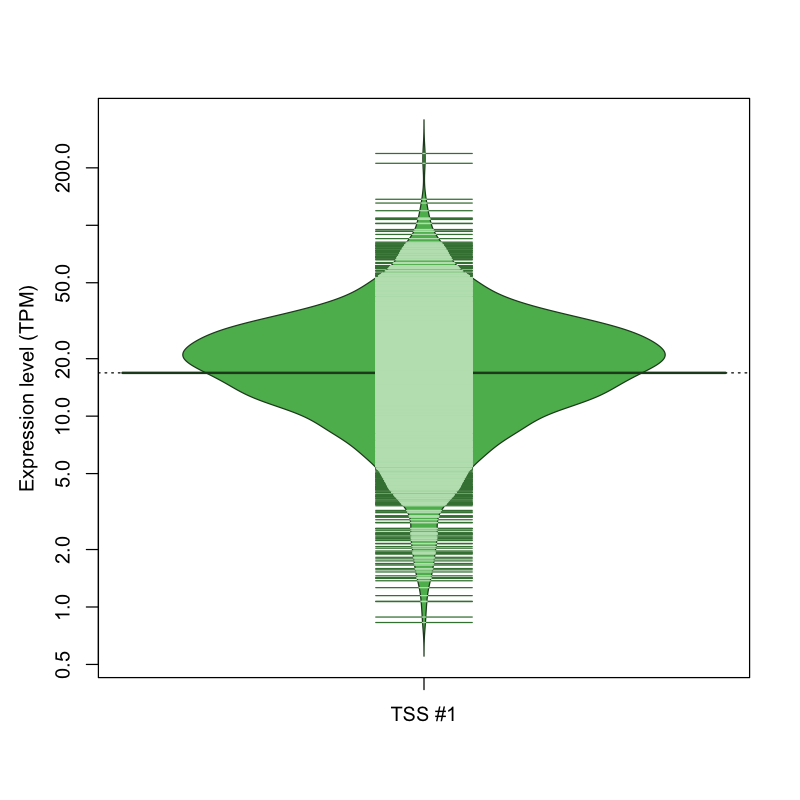
| TSS No. | TSS Name | TSS expression level (Expr) in TPM range: | ||||
|---|---|---|---|---|---|---|
| no expression | 0 < Expr ≤ 1 | 1 < Expr ≤ 5 | 5 < Expr ≤ 10 | Expr > 10 | ||
| TSS #1 | TSS_70073 | 55 libraries | 2 libraries | 118 libraries | 246 libraries | 1408 libraries |
The graphical summary, for retro_hsap_2030 TSS expression levels > 0 TPM .
TSS expression levels were studied across 1829 TSS-CAGE libraries, based on FANTOM5 data.
The expression values were visualized using beanplot. If you have any doubts, how to read it, read more in Kampstra P (2008)
retro_hsap_2030 was not experimentally validated.
Retrocopy orthology:
Retrocopy retro_hsap_2030 has 0 orthologous retrocopies within eutheria group .Parental genes homology:
Parental genes homology involve 7 parental genes, and 19 retrocopies.| Species | Parental gene accession | Retrocopies number | |
|---|---|---|---|
| Bos taurus | ENSBTAG00000007454 | 2 retrocopies | |
| Homo sapiens | ENSG00000147403 | 3 retrocopies |
retro_hsap_2030 , retro_hsap_3265, retro_hsap_3437,
|
| Macropus eugenii | ENSMEUG00000013163 | 3 retrocopies | |
| Myotis lucifugus | ENSMLUG00000014337 | 3 retrocopies | |
| Monodelphis domestica | ENSMODG00000008731 | 2 retrocopies | |
| Mus musculus | ENSMUSG00000008682 | 1 retrocopy | |
| Pongo abelii | ENSPPYG00000020874 | 5 retrocopies |
Expression level across human populations :
| Library | Retrogene expression |
|---|---|
| CEU_NA11831 | 4 .56 RPM |
| CEU_NA11843 | 4 .04 RPM |
| CEU_NA11930 | 5 .77 RPM |
| CEU_NA12004 | 2 .17 RPM |
| CEU_NA12400 | 4 .14 RPM |
| CEU_NA12751 | 2 .96 RPM |
| CEU_NA12760 | 7 .41 RPM |
| CEU_NA12827 | 4 .20 RPM |
| CEU_NA12872 | 3 .57 RPM |
| CEU_NA12873 | 2 .90 RPM |
| FIN_HG00183 | 5 .02 RPM |
| FIN_HG00277 | 2 .85 RPM |
| FIN_HG00315 | 3 .17 RPM |
| FIN_HG00321 | 3 .48 RPM |
| FIN_HG00328 | 2 .44 RPM |
| FIN_HG00338 | 3 .30 RPM |
| FIN_HG00349 | 5 .12 RPM |
| FIN_HG00375 | 4 .03 RPM |
| FIN_HG00377 | 4 .11 RPM |
| FIN_HG00378 | 3 .00 RPM |
| GBR_HG00099 | 3 .81 RPM |
| GBR_HG00111 | 3 .33 RPM |
| GBR_HG00114 | 2 .79 RPM |
| GBR_HG00119 | 2 .87 RPM |
| GBR_HG00131 | 3 .16 RPM |
| GBR_HG00133 | 3 .40 RPM |
| GBR_HG00134 | 2 .84 RPM |
| GBR_HG00137 | 4 .12 RPM |
| GBR_HG00142 | 3 .08 RPM |
| GBR_HG00143 | 2 .49 RPM |
| TSI_NA20512 | 2 .60 RPM |
| TSI_NA20513 | 2 .39 RPM |
| TSI_NA20518 | 4 .30 RPM |
| TSI_NA20532 | 3 .13 RPM |
| TSI_NA20538 | 4 .01 RPM |
| TSI_NA20756 | 4 .45 RPM |
| TSI_NA20765 | 2 .71 RPM |
| TSI_NA20771 | 5 .45 RPM |
| TSI_NA20786 | 2 .88 RPM |
| TSI_NA20798 | 3 .40 RPM |
| YRI_NA18870 | 6 .87 RPM |
| YRI_NA18907 | 3 .19 RPM |
| YRI_NA18916 | 2 .76 RPM |
| YRI_NA19093 | 2 .76 RPM |
| YRI_NA19099 | 3 .75 RPM |
| YRI_NA19114 | 3 .25 RPM |
| YRI_NA19118 | 3 .34 RPM |
| YRI_NA19213 | 2 .27 RPM |
| YRI_NA19214 | 2 .12 RPM |
| YRI_NA19223 | 2 .33 RPM |
Indel association:
The presence of retro_hsap_2030 across human populations is associated with 1 indel. The percentage values indicate the frequencies of retro_hsap_2030 presence in various populations. Based on Kabza et al. 2015 (PubMed).| # | Indel coordinates | AFR, African | AMR, Ad Mixed American | EUR, European | EAS, East Asian | ||||||||||
|---|---|---|---|---|---|---|---|---|---|---|---|---|---|---|---|
| ASW | YRI | LWK | MXL | PUR | CLM | CEU | IBS | GBR | FIN | TSI | JPT | CHB | CHS | ||
| 1. | 19:12753336..12754500 | 97.54 | 100 | 98.45 | 83.33 | 88.18 | 87.5 | 90.59 | 92.86 | 91.01 | 89.25 | 94.39 | 95.51 | 92.78 | 91 |
Indel #1, located at the genomic coordinates 19:12753336..12754500.